import re
import csv
import pandas as pd
# DOJ State Crime Estimates
csv_file = 'CrimeStatebyState.csv'
# Variable for keeping track of current state in the file
state = ''
# Store the output (list of dictionaries, for importing into pandas)
data = []
with open(csv_file) as f:
# Use csv module to read file
reader = csv.reader(f)
for line in reader:
# Skip blank lines
if len(line) > 0:
if line[0][:9] == 'Estimated':
#regular expression
matches = re.search('Estimated crime in (.*)$', line[0])
state = matches.group(1)
elif state and state != 'United States-Total' and line[0] != 'Year':
state_dict = {
'State': state,
'Year': line[0],
'Population': line[1],
'Violent crime total': line[2]
}
data.append(state_dict)
df = pd.DataFrame(data)
print(df) State Year Population Violent crime total
0 Alabama 1985 4021000 18398
1 Alabama 1986 4053000 22616
2 Alabama 1987 4083000 22833
3 Alabama 1988 4127000 23052
4 Alabama 1989 4118000 24329
... ... ... ... ...
1525 Wyoming 2010 564554 1117
1526 Wyoming 2011 567356 1245
1527 Wyoming 2012 576626 1161
1528 Wyoming 2013 583223 1212
1529 Wyoming 2014 584153 1142
[1530 rows x 4 columns]# Part B
import re
import csv
import pandas as pd
import geopandas as gpd
import matplotlib.pyplot as plt#read txt file
with open("C:/Users/ashle/Downloads/lab11/worldcities.txt", "r", encoding="utf-8") as f:
lines = f.readlines()
# DMS lat & long
pattern = re.compile(
r"^(.*?)\t" # City/Place name
r"(\d+)°(\d+)'([NS])\t" # Latitude DMS
r"(\d+)°(\d+)'([EW])" # Longitude DMS
)
def dms_to_dd(deg, minutes, hemi):
dec = float(deg) + float(minutes)/60
if hemi in ["S", "W"]:
dec *= -1
return dec
records = []
for line in lines:
m = pattern.search(line)
if m:
city = m.group(1).strip()
lat_deg, lat_min, lat_dir = m.group(2), m.group(3), m.group(4)
lon_deg, lon_min, lon_dir = m.group(5), m.group(6), m.group(7)
lat_dd = dms_to_dd(lat_deg, lat_min, lat_dir)
lon_dd = dms_to_dd(lon_deg, lon_min, lon_dir)
records.append([city, lat_dd, lon_dd])
#dataframe
df = pd.DataFrame(records, columns = ['city', 'latitude', 'longitude'])
#geodataframe
gdf = gpd.GeoDataFrame(df, geometry=gpd.points_from_xy(df["longitude"], df["latitude"]),
crs="EPSG:4326")
#map with geodataframe
# Download and use the data directly
import requests
import io
url = "https://naciscdn.org/naturalearth/110m/cultural/ne_110m_admin_0_countries.zip"
r = requests.get(url)
world = gpd.read_file(io.BytesIO(r.content))
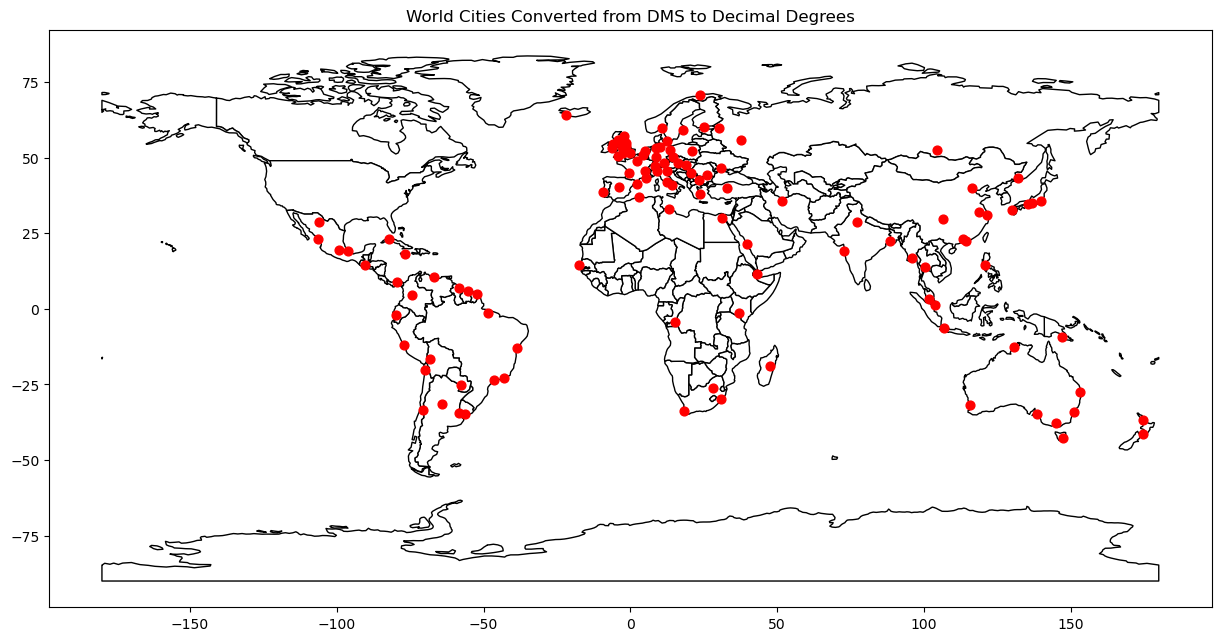
ax = world.plot(figsize=(15, 10), edgecolor="black", color="white")
gdf.plot(ax=ax, color="red", markersize=40)
ax.set_title("World Cities Converted from DMS to Decimal Degrees")C:\Users\ashle\anaconda3\Lib\site-packages\pyogrio\core.py:35: RuntimeWarning: Could not detect GDAL data files. Set GDAL_DATA environment variable to the correct path.
_init_gdal_data()Text(0.5, 1.0, 'World Cities Converted from DMS to Decimal Degrees')